Predicting Road Accident Risk

数据来源
https://www.kaggle.com/competitions/playground-series-s5e10
查看数据
1 | ''' |
1 | import pandas as pd |
| id | road_type | num_lanes | curvature | speed_limit | lighting | weather | road_signs_present | public_road | time_of_day | holiday | school_season | num_reported_accidents | accident_risk |
|---|---|---|---|---|---|---|---|---|---|---|---|---|---|
| 0 | urban | 2 | 0.06 | 35 | daylight | rainy | False | True | afternoon | False | True | 1 | 0.13 |
| 1 | urban | 4 | 0.99 | 35 | daylight | clear | True | False | evening | True | True | 0 | 0.35 |
| 2 | rural | 4 | 0.63 | 70 | dim | clear | False | True | morning | True | False | 2 | 0.30 |
| 3 | highway | 4 | 0.07 | 35 | dim | rainy | True | True | morning | False | False | 1 | 0.21 |
| 4 | rural | 1 | 0.58 | 60 | daylight | foggy | False | False | evening | True | False | 1 | 0.56 |
1 | df_train.info() |
Column Non-Null Count Dtype
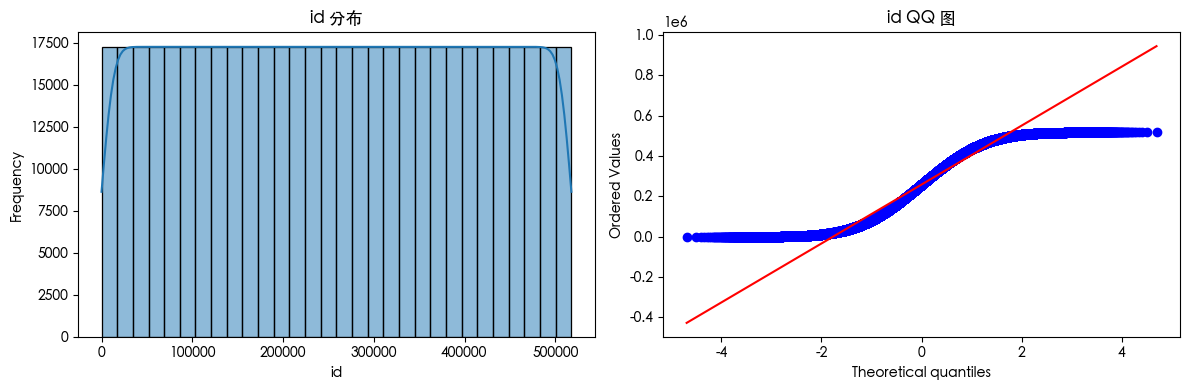
0 id 517754 non-null int64
1 road_type 517754 non-null object
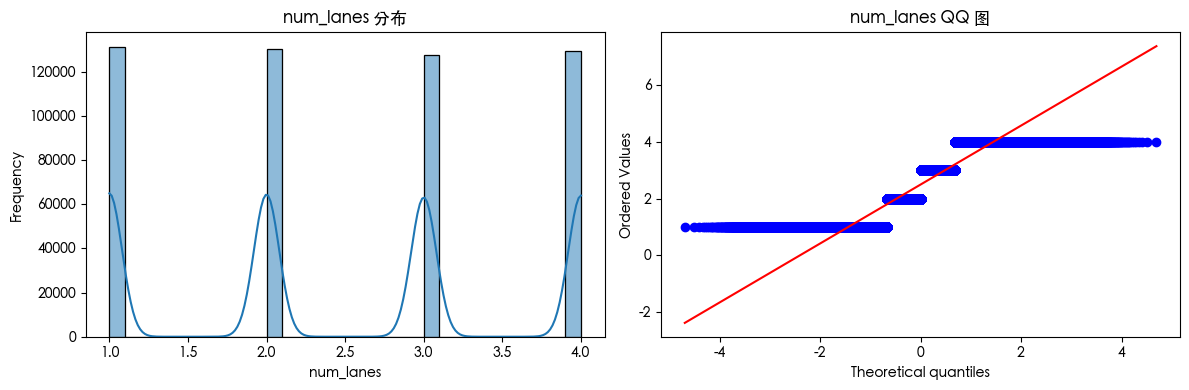
2 num_lanes 517754 non-null int64
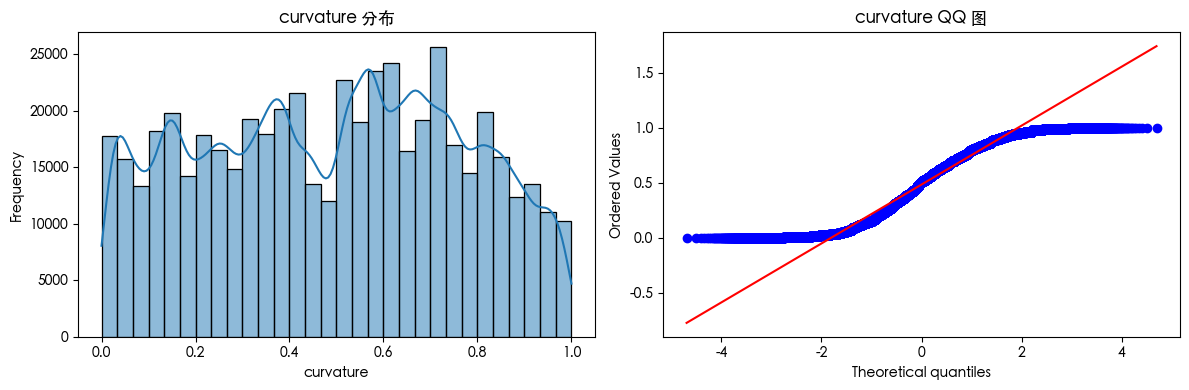
3 curvature 517754 non-null float64
4 speed_limit 517754 non-null int64
5 lighting 517754 non-null object
6 weather 517754 non-null object
7 road_signs_present 517754 non-null bool
8 public_road 517754 non-null bool
9 time_of_day 517754 non-null object
10 holiday 517754 non-null bool
11 school_season 517754 non-null bool
12 num_reported_accidents 517754 non-null int64
13 accident_risk 517754 non-null float64
- id 编号
- road_type 道路类型
- num_lanes 车道数量
- curvature 曲率
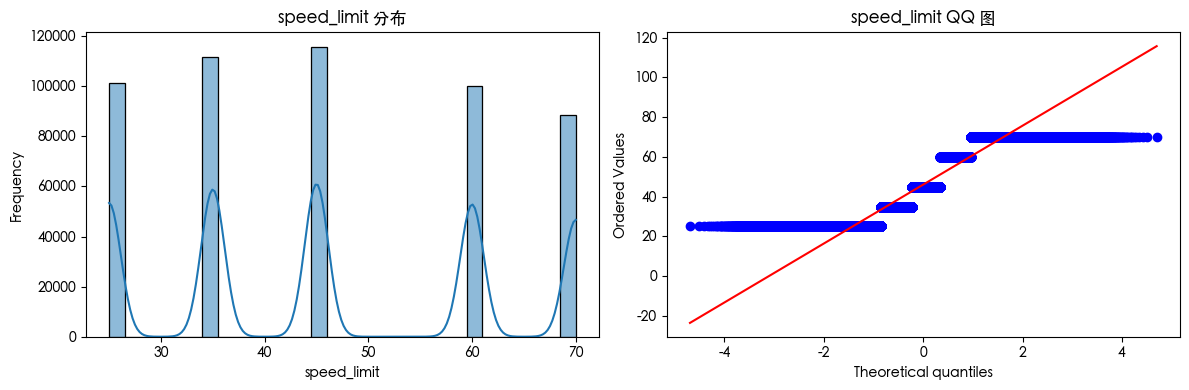
- speed_limit 最高限速
- lighting 照明条件
- weather 天气条件
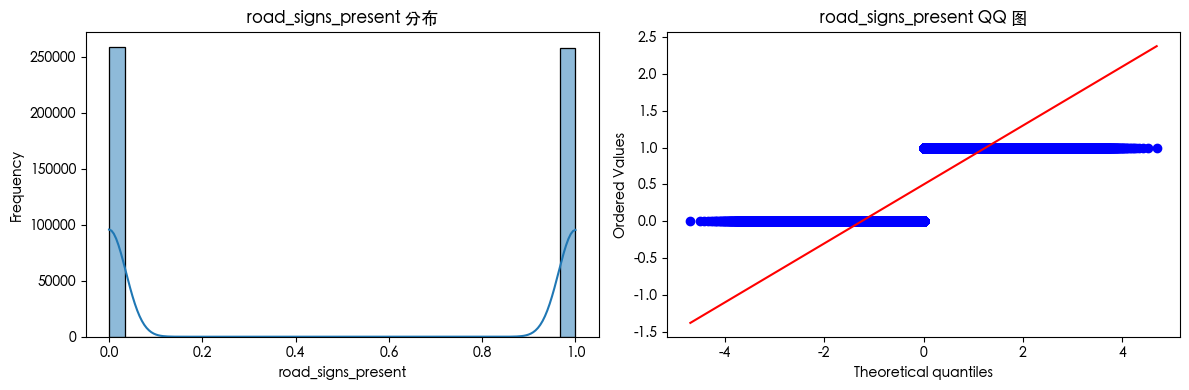
- road_signs_present 是否有道路标识
- public_road 是否为公共道路
- time_of_day 时间(早中晚)
- holiday 是否是假期
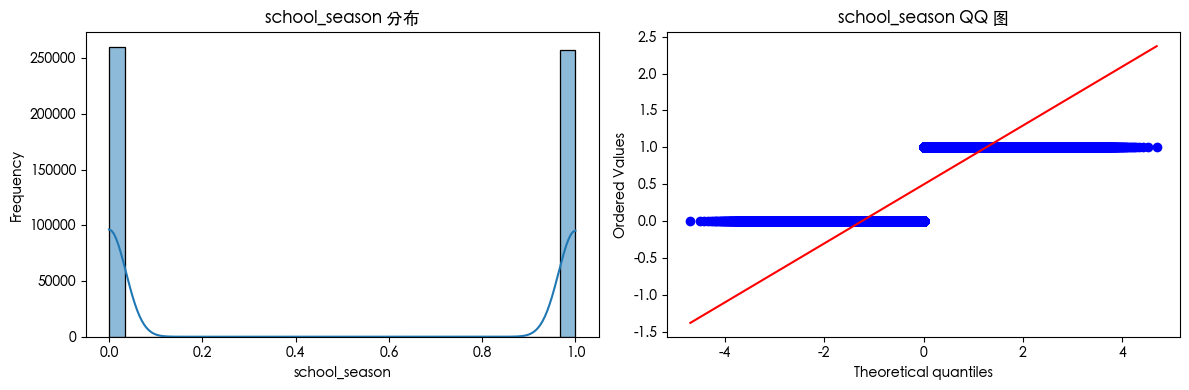
- school_season 是否是开学季
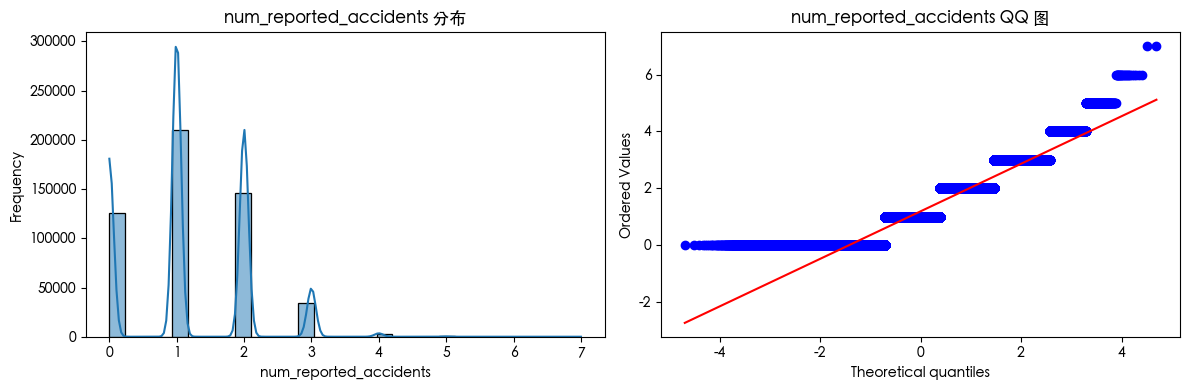
- num_reported_accidents 报告的交通事故数量
- accident_risk 交通事故风险等级
缺失值检测
1 | df_train.isnull().sum() |
id 0
road_type 0
num_lanes 0
curvature 0
speed_limit 0
lighting 0
weather 0
road_signs_present 0
public_road 0
time_of_day 0
holiday 0
school_season 0
num_reported_accidents 0
accident_risk 0
dtype: int64
查看后可知 该数据集没有缺失值
异常值
1 | from scipy import stats |
列 id 中的异常值数量: 0
列 num_lanes 中的异常值数量: 0
列 curvature 中的异常值数量: 0
列 speed_limit 中的异常值数量: 0
列 road_signs_present 中的异常值数量: 0
列 public_road 中的异常值数量: 0
列 holiday 中的异常值数量: 0
列 school_season 中的异常值数量: 0
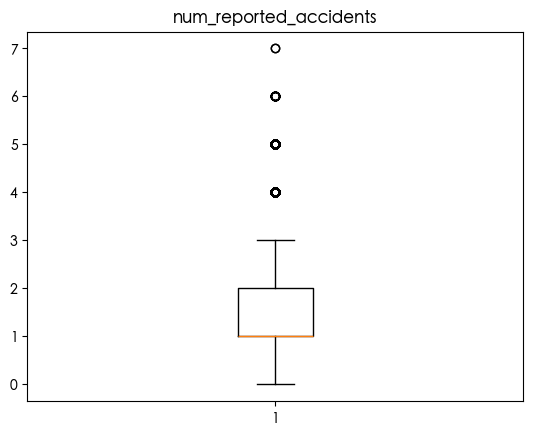
列 num_reported_accidents 中的异常值数量: 2649
列 accident_risk 中的异常值数量: 1163
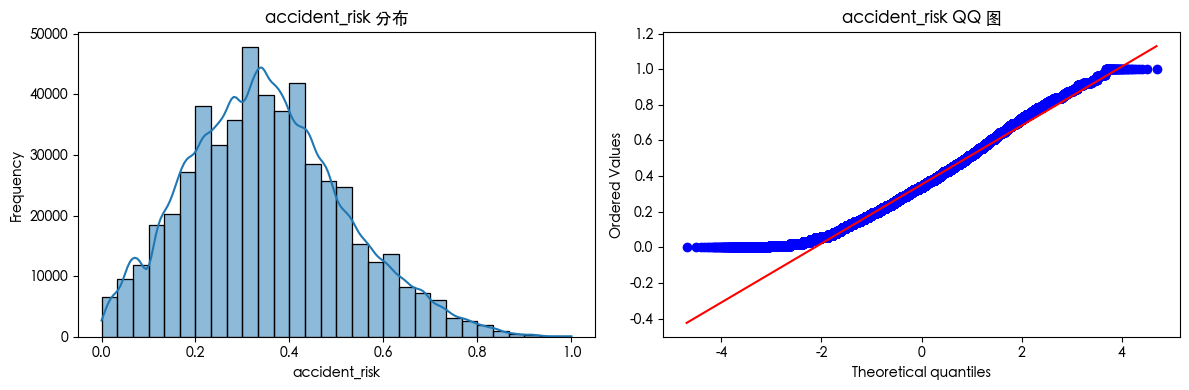
发现 num_reported_accidents 和 accident_risk 存在异常值 由于 accident_risk 是我们要预测的目标 这说明 accident_risk 中数据分布是不平衡的
1 | plt.boxplot(df_train['num_reported_accidents']) |
EDA
1 | from scipy import stats |


1 | df_num = df_train.select_dtypes(include=['int64', 'float64', 'bool']) |
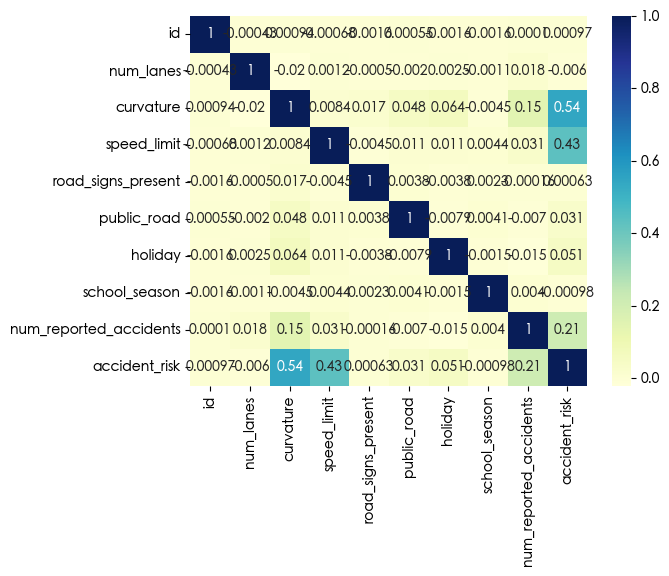
我们可以看到 curvature speed_limit num_reported_accidents 和 accident_risk 之间有很强的相关性
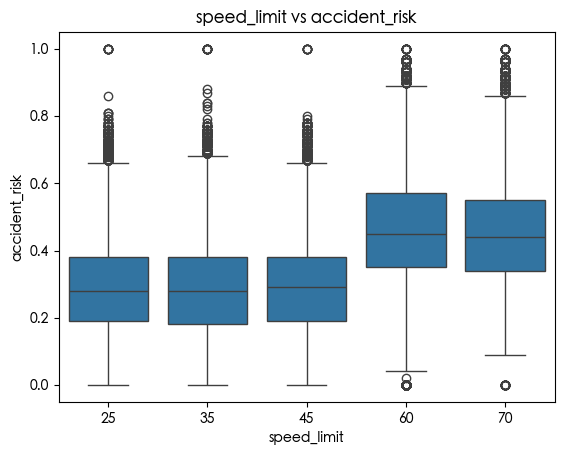
1 | sns.boxplot( |
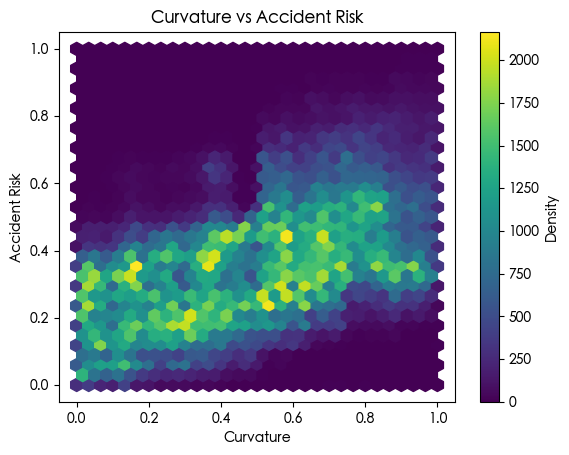
1 | plt.hexbin(df_train['curvature'], df_train['accident_risk'], gridsize=30, cmap='viridis') |
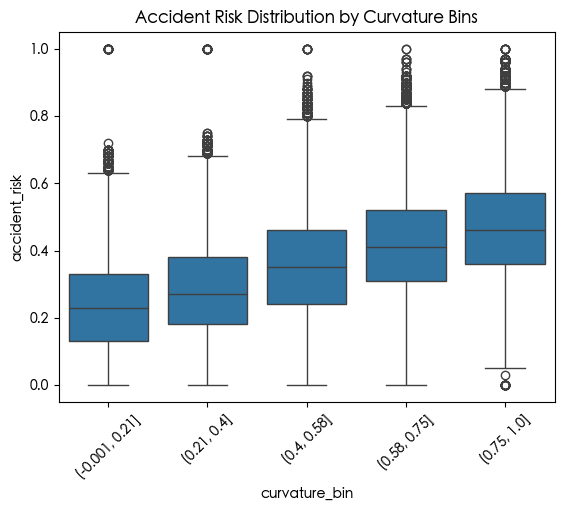
1 | df_train['curvature_bin'] = pd.qcut(df_train['curvature'], q=5) |
1 | sns.boxplot(x='num_reported_accidents', y='accident_risk', data=df_train) |
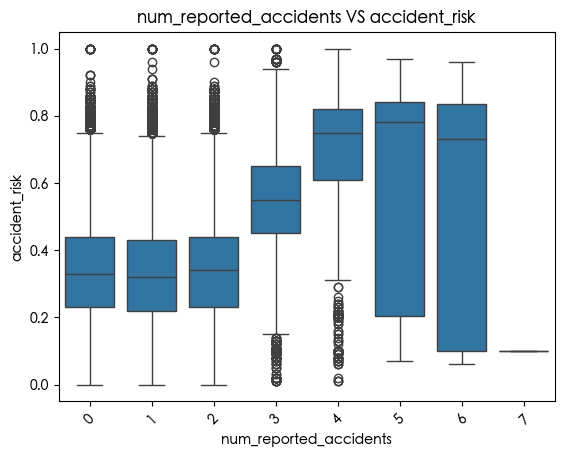
在我们的直觉中 交通事故数量越多 交通事故风险等级越高 但从图中可以看出 报告的事故数量从0-5风险逐渐变大 在4和5时风险最大 而到6和7时 风险反而变小了 这里我认为是由于道路交通部门发现了这段路报告的事故数量异常高 因此采取了某些举措从而降低了风险
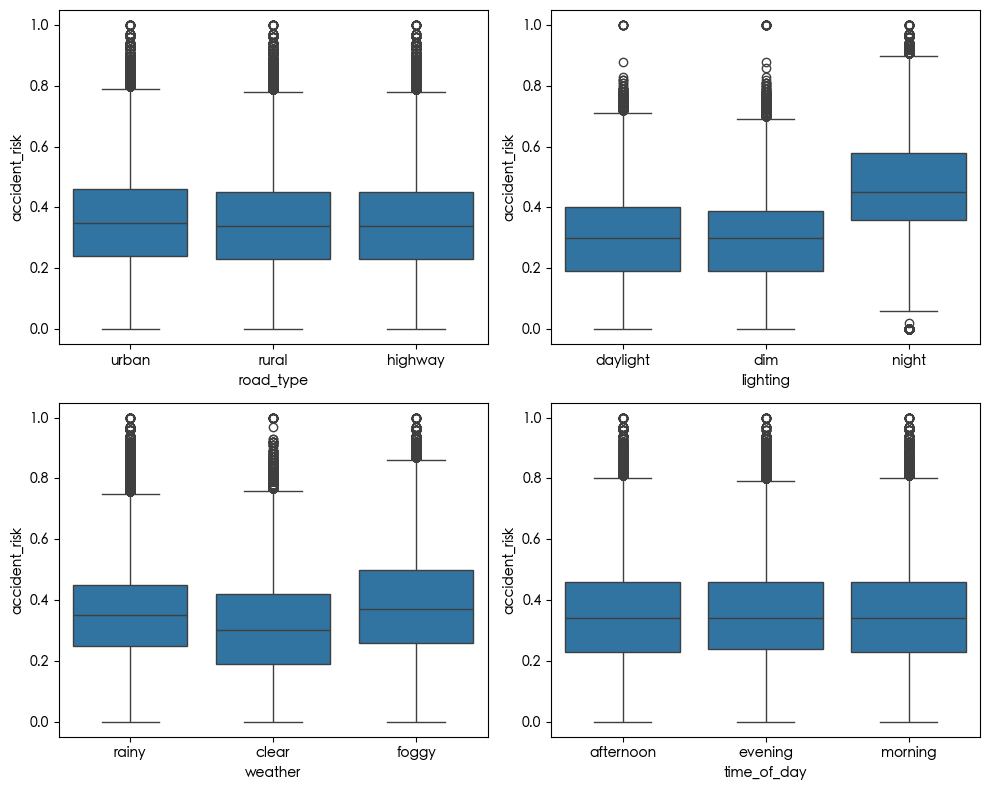
1 | fig, axes = plt.subplots(2, 2, figsize=(10,8)) |
特征工程
1 | df_obj = df_train.select_dtypes(include=['object']) |
Index([‘road_type’, ‘lighting’, ‘weather’, ‘time_of_day’], dtype=’object’)
1 | for col in df_obj.columns: |
列名:road_type
[‘urban’ ‘rural’ ‘highway’]列名:lighting
[‘daylight’ ‘dim’ ‘night’]列名:weather
[‘rainy’ ‘clear’ ‘foggy’]列名:time_of_day
[‘afternoon’ ‘evening’ ‘morning’]
由于road_type是无序的,我们对road_type进行one-hot编码
lighting和weather存在一定的顺序 这样模型能理解“夜晚比白天危险”、“雨天比晴天风险高”
time_of_day存在一定的顺序 因此使用正弦编码,模型这样可以感知“早晨和晚上”在周期上是相邻的,而不是数值差很大。
独热编码
1 | df_train = pd.get_dummies(df_train, columns=['road_type'], drop_first=False) |
标签编码
1 | lighting_map = {'daylight': 0, 'dim': 1, 'night': 2} |
正弦编码
1 | time_map = {'morning': 0, 'afternoon': 1, 'evening': 2} |
1 | df_train = df_train.drop(columns=['id', 'time_of_day', 'curvature_bin', 'time_code']) |
模型选择
1 | from xgboost import XGBRegressor |
XGBoost 模型得分: 0.8852848521865487
XGBoost 模型 RMSE: 0.05628087549522937
[LightGBM] [Info] Auto-choosing row-wise multi-threading, the overhead of testing was 0.003744 seconds.
You can set force_row_wise=true to remove the overhead.
And if memory is not enough, you can set force_col_wise=true.
[LightGBM] [Info] Total Bins 170
[LightGBM] [Info] Number of data points in the train set: 414203, number of used features: 14
[LightGBM] [Info] Start training from score 0.352605
LightGBM 模型得分: 0.8850232397713161
LightGBM 模型 RMSE: 0.05634501432550113
随机森林
你也可以使用随机森林进行 不过在我的电脑上随机森林运行时间比较长(1分30秒) 我就贴出了我自己运行的结果
RandomForest 模型得分: 0.8721398843806608
RandomForest 模型 RMSE: 0.059417996862623244
测试集处理
1 | df_test = pd.read_csv('test.csv') |
提交数据
1 | submission = pd.DataFrame({ |
其成绩判定的方式是RMSE 我的成绩是0.05569
- Title: Predicting Road Accident Risk
- Author: 姜智浩
- Created at : 2025-10-11 11:45:14
- Updated at : 2025-10-13 13:36:27
- Link: https://super-213.github.io/zhihaojiang.github.io/2025/10/11/20251013Predicting Road Accident Risk/
- License: This work is licensed under CC BY-NC-SA 4.0.