Eco-Driving Behavior

数据来源
https://www.kaggle.com/datasets/sonalshinde123/eco-driving-behavior-dataset/data
概览
About Dataset
🚗 Introduction
The Eco-Driving Behavior Dataset is a large-scale synthetic dataset consisting of 30,000 rows, designed to simulate realistic vehicle driving behavior and fuel efficiency patterns. It represents trip-level driving metrics commonly captured by vehicle telematics systems, on-board diagnostics (OBD), and CAN-based sensors.
The dataset is especially useful for machine learning modeling, statistical analysis, and benchmarking, where real-world driving data is often difficult to obtain due to privacy, cost, and accessibility constraints.
🌱 Objective
The primary goal of this dataset is to help analyze how different driving behaviors impact fuel consumption and an overall eco-driving score, which reflects driving efficiency and environmental friendliness.
The dataset allows users to:
Study correlations between driving habits and eco-efficiency
Build predictive models for eco-driving scores
Experiment with feature engineering techniques
Compare regression and classification approaches on the same data
🧩 Feature-Level Explanation
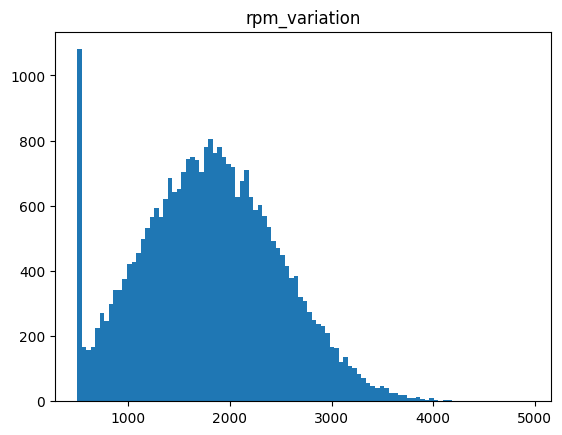
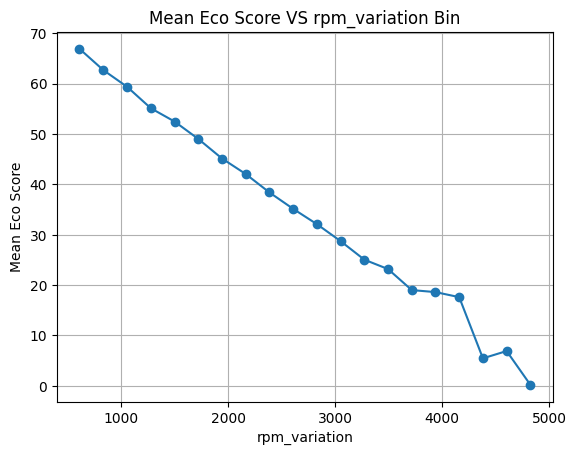
1.rpm_variation
Captures how much the engine RPM fluctuates during a trip. Higher values typically indicate aggressive throttle usage, frequent gear changes, or unstable driving patterns.
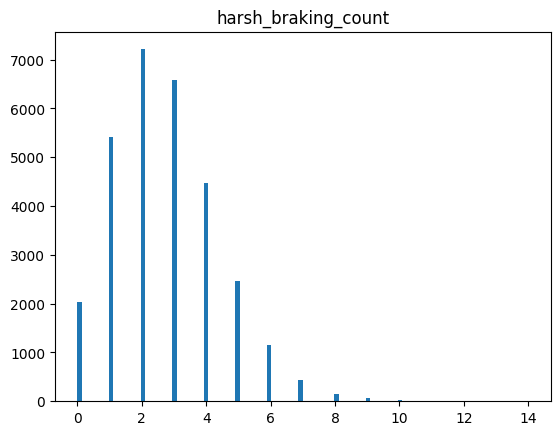
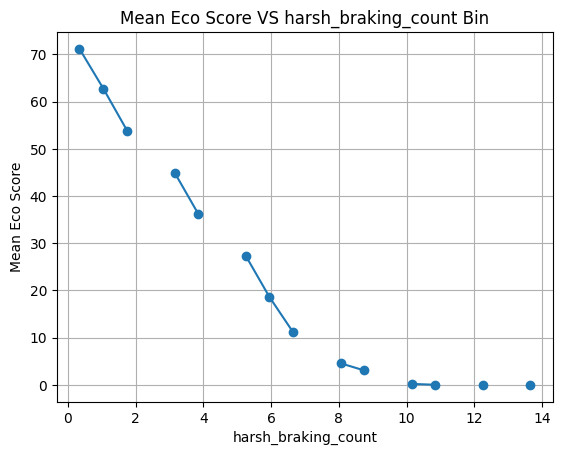
2.harsh_braking_count
Represents the number of sudden braking events detected during the trip. Frequent harsh braking is usually associated with unsafe and inefficient driving behavior.
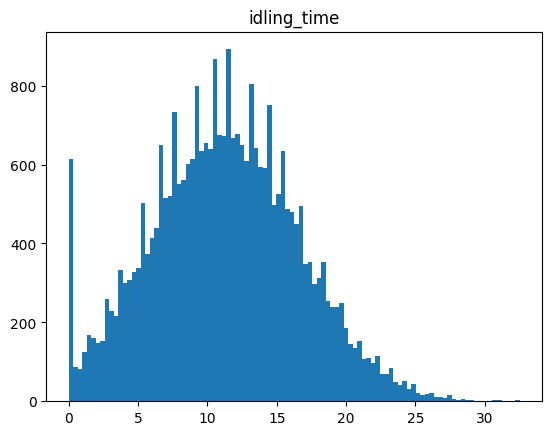
3.idling_time
Measures the total duration (in minutes) when the vehicle engine was running without movement. Excessive idling leads to unnecessary fuel consumption and lower eco-efficiency.
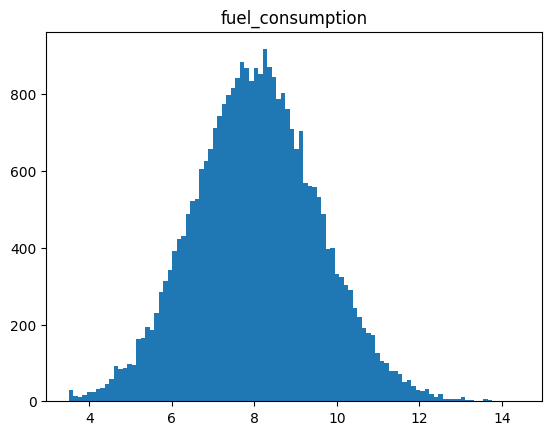
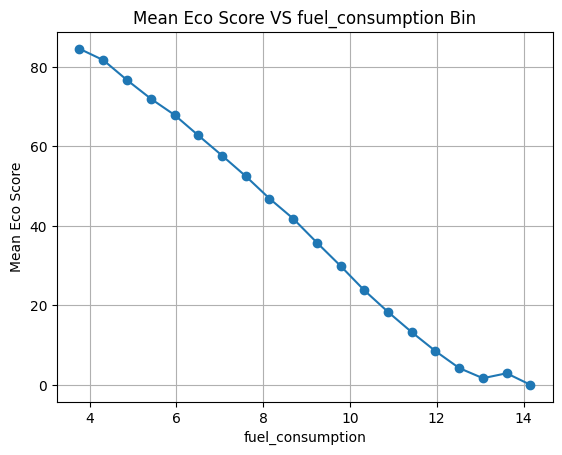
4.fuel_consumption
Indicates the fuel consumption rate for the trip. Higher values generally correspond to inefficient driving or heavy traffic conditions.
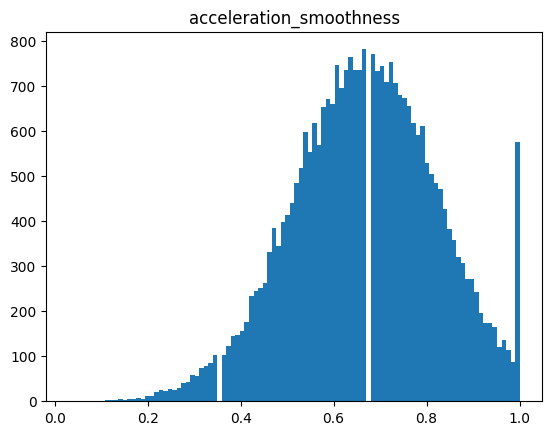
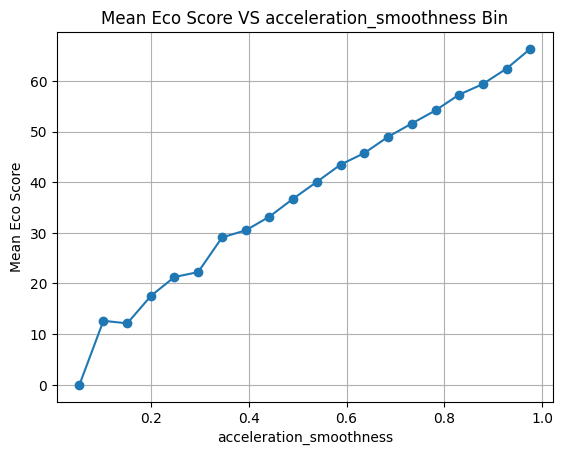
5.acceleration_smoothness
A normalized score (0–1) indicating how smoothly the driver accelerates. Higher values reflect smoother acceleration, reduced mechanical stress, and better fuel economy.
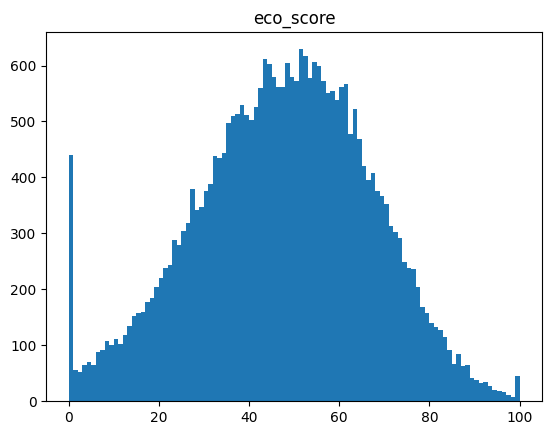
6.eco_score
A composite score derived from all behavioral factors. It reflects overall driving efficiency, environmental impact, and smoothness of driving behavior. This variable is ideal as a regression target or can be discretized for classification tasks (e.g., Poor / Average / Good driving).
🧪 Synthetic Data Generation Approach
The dataset was generated using:
Controlled statistical distributions
Feature inter-dependencies (e.g., harsh braking impacting fuel consumption)
Randomized noise to avoid overly deterministic patterns
Special care was taken to ensure:
Realistic feature ranges
Natural variance across trips
No perfect correlations
ML-friendly structure for experimentation
导入库
1 | import pandas as pd |
1 | df = pd.read_csv('eco_driving_score.csv') |
1.rpm_variation 1.转速变化
Captures how much the engine RPM fluctuates during a trip. Higher values typically indicate aggressive throttle usage, frequent gear changes, or unstable driving patterns.
记录行驶过程中发动机转速的波动幅度。数值越高,通常表示油门使用过于激进、频繁换挡或驾驶习惯不稳定。
2.harsh_braking_count 2.急刹车次数
Represents the number of sudden braking events detected during the trip. Frequent harsh braking is usually associated with unsafe and inefficient driving behavior.
表示行程中检测到的急刹车事件次数。频繁的急刹车通常与不安全和低效的驾驶行为有关。
3.idling_time 3.空闲时间
Measures the total duration (in minutes) when the vehicle engine was running without movement. Excessive idling leads to unnecessary fuel consumption and lower eco-efficiency.
测量车辆发动机空转但车辆不移动的总时长(以分钟为单位)。怠速时间过长会导致不必要的燃油消耗和降低环保效率。
4.fuel_consumption 4.燃油消耗
Indicates the fuel consumption rate for the trip. Higher values generally correspond to inefficient driving or heavy traffic conditions.
表示本次行程的燃油消耗率。数值越高,通常表示驾驶效率低下或交通拥堵情况越严重。
5.acceleration_smoothness
5.加速度平滑度
A normalized score (0–1) indicating how smoothly the driver accelerates. Higher values reflect smoother acceleration, reduced mechanical stress, and better fuel economy.
标准化评分(0-1)表示驾驶员加速的平顺程度。数值越高,表示加速越平顺、机械应力越小、燃油经济性越好。
6.eco_score 6.生态评分
A composite score derived from all behavioral factors. It reflects overall driving efficiency, environmental impact, and smoothness of driving behavior. This variable is ideal as a regression target or can be discretized for classification tasks (e.g., Poor / Average / Good driving).
该综合评分由所有行为因素构成,反映了整体驾驶效率、环境影响和驾驶行为的流畅性。该变量非常适合作为回归目标,也可以离散化用于分类任务(例如,驾驶水平差/一般/良好)。
EDA
1 | import matplotlib.pyplot as plt |
1 | for col in df.columns: |
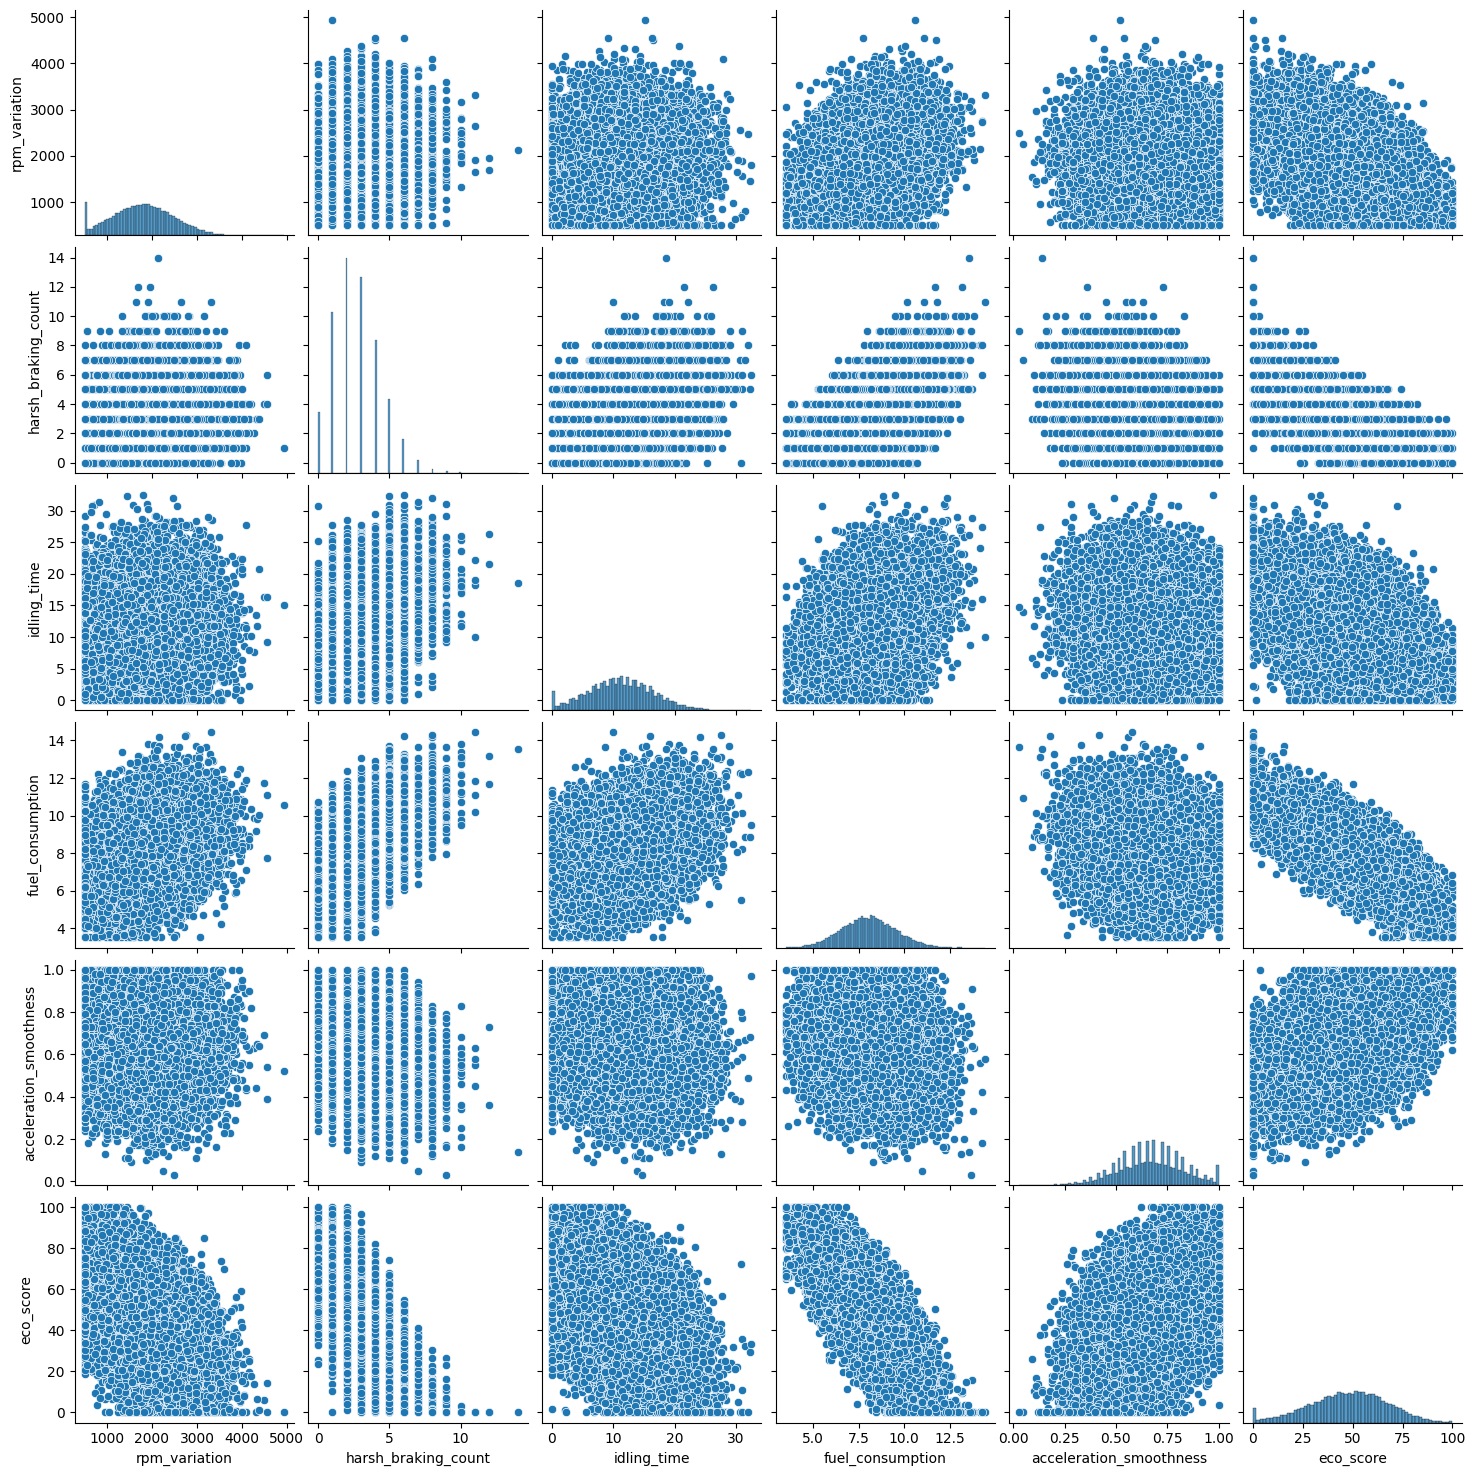
1 | sns.pairplot(df) |
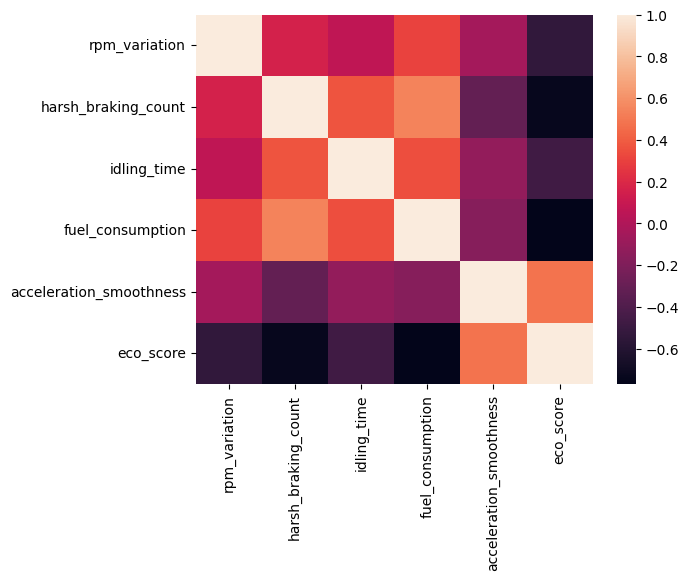
1 | sns.heatmap(df.corr()) |
1 | cols = ['rpm_variation', 'harsh_braking_count', 'idling_time', 'fuel_consumption', 'acceleration_smoothness'] |
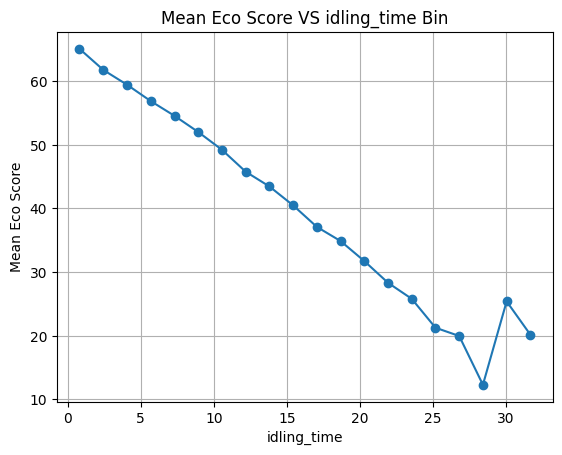
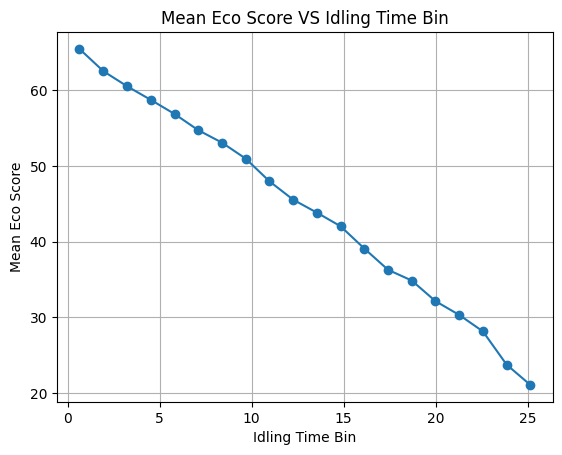
随着怠速时间的增加 ECO得分降低 但是可以看到一个一场的点 当怠速时间超过27分钟后 得分反而会升高
1 | plt.boxplot(df['idling_time']) |
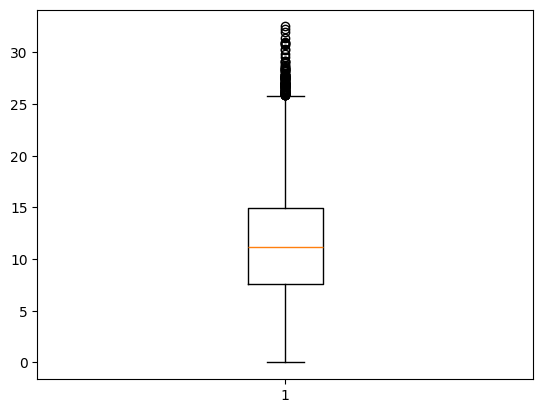
1 | Q1 = df["idling_time"].quantile(0.25) |
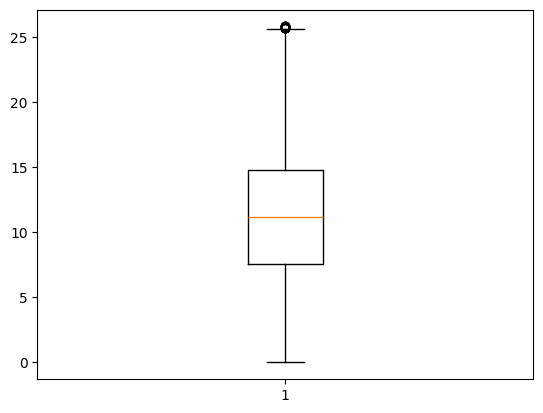
1 | plt.boxplot(df['idling_time']) |
1 | df['idling_time_bin'] = pd.cut(df['idling_time'], bins=20) |
数据划分
1 | from sklearn.model_selection import train_test_split |
模型选择
1 | from sklearn.ensemble import RandomForestRegressor |
1 | rm = RandomForestRegressor() |
0.9250779240975352
1 | xgb = XGBRegressor() |
0.9244345372632315
RM GV
1 | from sklearn.model_selection import RandomizedSearchCV |
Best params (Random): {‘max_depth’: 44, ‘max_features’: ‘sqrt’, ‘min_samples_leaf’: 1, ‘min_samples_split’: 12, ‘n_estimators’: 200}
Best R2 (Random): 0.9286245296105547
1 | rm = RandomForestRegressor( |
R2 Score: 0.928480167672461
特征重要性
1 | import shap |
分析
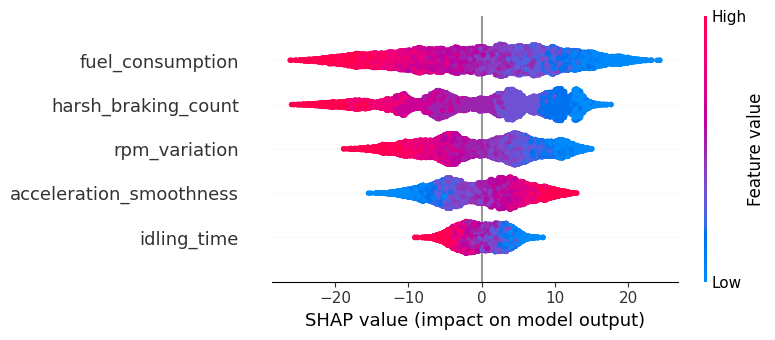
1 fuel_consumption(燃油消耗)
- 影响范围最大,说明它对模型输出影响最显著。
- 红色部分集中在右侧 → 当燃油消耗高时,模型倾向于预测更高的输出
- 蓝色部分集中在左侧 → 燃油消耗低 → 模型预测值偏低
结论:燃油消耗越高,模型预测值越大 → 代表“更耗油”、“更不经济”的驾驶行为
2 harsh_braking_count(急刹车次数)
- 影响第二
- 高值(红)集中在右侧 → 急刹车多 → 模型预测值高 → 可能代表“危险驾驶”
- 低值(蓝)集中在左侧 → 急刹车少 → 预测值低 → 更安全/平稳
结论:急刹车次数越多,模型认为驾驶风险/成本越高
3 rpm_variation(转速波动)
- 影响中等
- 分布较对称,但高值略偏向右侧 → 转速波动大 → 预测值偏高
结论:转速不稳定可能被模型视为“不良驾驶习惯”
4 acceleration_smoothness(加速平顺性)
- 影响较小(约 -10 到 +10)
- 有趣的是:高值集中在左侧! → 加速越平顺,SHAP 值为负 → 模型预测值降低
结论:加速越平顺 → 预测值越低 → 代表更优驾驶行为)
5 idling_time(怠速时间)
- 影响最小(约 -8 到 +8)
- 高值(红)在右侧 → 怠速时间长 → 预测值高 → 代表“浪费燃油”或“效率低”
结论:怠速时间越长,模型预测值越高 → 不良行为
整体模型行为总结
| 特征 | 对模型输出影响方向 | 含义 |
|---|---|---|
| fuel_consumption | ↑ 高 → 输出↑ | 越耗油,风险/成本越高 |
| harsh_braking_count | ↑ 多 → 输出↑ | 急刹车多,驾驶风险高 |
| rpm_variation | ↑ 波动大 → 输出↑ | 转速不稳,驾驶不规范 |
| acceleration_smoothness | ↑ 平顺 → 输出↓ | 加速越平顺,驾驶越好 |
| idling_time | ↑ 长 → 输出↑ | 怠速久,效率低/浪费 |
建议
优化驾驶行为:
- 减少急刹车、控制转速波动、提升加速平顺性 → 可显著降低模型预测的“风险评分”
- Title: Eco-Driving Behavior
- Author: 姜智浩
- Created at : 2026-01-20 11:45:14
- Updated at : 2026-01-20 19:09:58
- Link: https://super-213.github.io/zhihaojiang.github.io/2026/01/20/20260120Eco-Driving Behavior/
- License: This work is licensed under CC BY-NC-SA 4.0.