前期准备
导入一些必要库
1
2
3
| import pandas as pd
import numpy as np
import matplotlib.pyplot as plt
|
查看数据
1
2
3
| df.head()
df.isnull().sum()
|
工龄 0
薪水 0
dtype: int64
|
工龄 |
薪水 |
| 0 |
0.0 |
3178 |
| 1 |
0.1 |
5672 |
| 2 |
0.2 |
5361 |
| 3 |
0.3 |
5146 |
| 4 |
0.3 |
5050 |
1
2
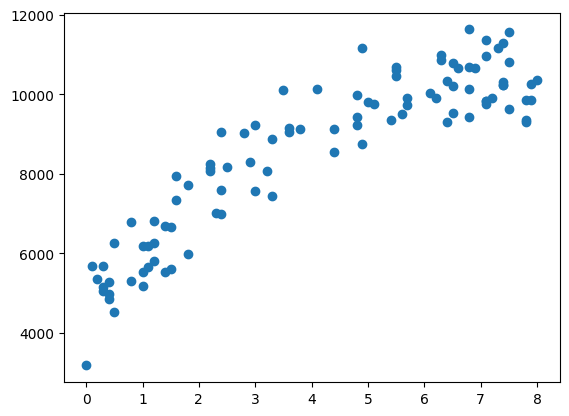
| plt.scatter(df['工龄'], df['薪水'])
plt.show()
|

1
2
3
4
5
6
7
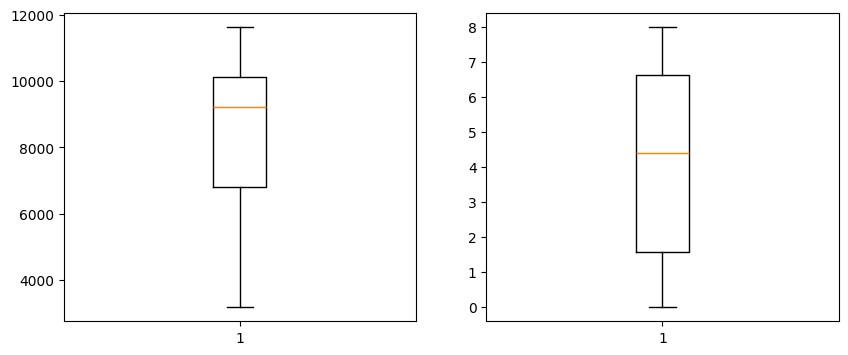
| plt.figure(figsize=(10, 4))
plt.subplot(1,2,1)
plt.boxplot(df['薪水'])
plt.subplot(1,2,2)
plt.boxplot(df['工龄'])
plt.show()
|
发现数据无异常值和缺失值,接下来我们直接使用各种模型进行应用
拆分数据
1
2
3
4
| from sklearn.model_selection import train_test_split
from sklearn.metrics import mean_squared_error, r2_score
x_train, x_test, y_train, y_test = train_test_split(df[['工龄']], df['薪水'], test_size=0.2, random_state=42)
|
线性回归
1
2
3
4
5
6
7
8
| from sklearn.linear_model import LinearRegression
lr = LinearRegression()
lr.fit(x_train, y_train)
y_pred = lr.predict(x_test)
print('mse:', mean_squared_error(y_test, y_pred))
print('r2:', r2_score(y_test, y_pred))
|
mse: 1111088.6497048205
r2: 0.785598944374047
随机森林
1
2
3
4
5
6
7
8
| from sklearn.ensemble import RandomForestRegressor
rm = RandomForestRegressor()
rm.fit(x_train, y_train)
y_pred = rm.predict(x_test)
print('mse:', mean_squared_error(y_test, y_pred))
print('r2:', r2_score(y_test, y_pred))
|
mse: 1133556.3043982873
r2: 0.7812634767360701
XGBoost
1
2
3
4
5
6
7
8
| from xgboost import XGBRegressor
xgb = XGBRegressor(random_state=42)
xgb.fit(x_train, y_train)
y_pred_xgb = xgb.predict(x_test)
print("MSE:", mean_squared_error(y_test, y_pred_xgb))
print("r2:", r2_score(y_test, y_pred_xgb))
|
MSE: 1413782.32388587
r2: 0.7271897046676055
LGBM
1
2
3
4
5
6
7
8
| from lightgbm import LGBMRegressor
lgb = LGBMRegressor(random_state=42)
lgb.fit(x_train, y_train)
y_pred_lgb = lgb.predict(x_test)
print("MSE:", mean_squared_error(y_test, y_pred_lgb))
print("r2:", r2_score(y_test, y_pred_lgb))
|
MSE: 901347.2993528245
r2: 0.8260716527720919
SVM
1
2
3
4
5
6
7
8
9
10
11
12
13
14
| from sklearn.preprocessing import StandardScaler
from sklearn.svm import SVR
from sklearn.pipeline import Pipeline
svr_pipeline = Pipeline([
('scaler', StandardScaler()),
('svr', SVR(kernel='rbf', C=100, gamma='scale'))
])
svr_pipeline.fit(x_train, y_train)
y_pred = svr_pipeline.predict(x_test)
print("MSE:", mean_squared_error(y_test, y_pred))
print("r2:", r2_score(y_test, y_pred))
|
MSE: 1812311.167151214
r2: 0.6502876458479246
发现其效果并不好 SVM需要进行调参 使用网格优化
1
2
3
4
5
6
7
8
9
10
11
12
13
14
15
| from sklearn.model_selection import GridSearchCV
param_grid = {
'svr__C': [0.1, 1, 10, 100, 1000],
'svr__gamma': ['scale', 'auto', 0.001, 0.01, 0.1, 1],
'svr__kernel': ['rbf', 'poly', 'linear']
}
grid = GridSearchCV(svr_pipeline, param_grid, cv=5, scoring='r2', n_jobs=-1)
grid.fit(x_train, y_train)
print("最佳参数:", grid.best_params_)
print("最佳交叉验证r2:", grid.best_score_)
y_pred = grid.predict(x_test)
|
最佳参数: {‘svr__C’: 1000, ‘svr__gamma’: ‘scale’, ‘svr__kernel’: ‘rbf’}
最佳交叉验证r2: 0.8459784410080479